Hydrogen
N/A
Hydrogen is a chemical element with atomic number 1 which means there are 1 protons and 1 electrons in the atomic structure. The chemical symbol for Hydrogen is H.
With a standard atomic weight of circa 1.008, hydrogen is the lightest element on the periodic table. Its monatomic form (H) is the most abundant chemical substance in the Universe, constituting roughly 75% of all baryonic mass.
Helium
N/A
Helium is a chemical element with atomic number 2 which means there are 2 protons and 2 electrons in the atomic structure. The chemical symbol for Helium is He.
It is a colorless, odorless, tasteless, non-toxic, inert, monatomic gas, the first in the noble gas group in the periodic table. Its boiling point is the lowest among all the elements.
Lithium
1.5 MPa
Lithium is a chemical element with atomic number 3 which means there are 3 protons and 3 electrons in the atomic structure. The chemical symbol for Lithium is Li.
It is a soft, silvery-white alkali metal. Under standard conditions, it is the lightest metal and the lightest solid element. Like all alkali metals, lithium is highly reactive and flammable, and is stored in mineral oil.
Beryllium
345 MPa
Beryllium is a chemical element with atomic number 4 which means there are 4 protons and 4 electrons in the atomic structure. The chemical symbol for Beryllium is Be.
Beryllium is a hard, grayish metal naturally found in mineral rocks, coal, soil, and volcanic dust. The commercial use of beryllium requires the use of appropriate dust control equipment and industrial controls at all times because of the toxicity of inhaled beryllium-containing dusts that can cause a chronic life-threatening allergic disease in some people called berylliosis.
Boron
N/A
Boron is a chemical element with atomic number 5 which means there are 5 protons and 5 electrons in the atomic structure. The chemical symbol for Boron is B.
Significant concentrations of boron occur on the Earth in compounds known as the borate minerals. There are over 100 different borate minerals, but the most common are: borax, kernite, ulexite etc. Natural boron consists primarily of two stable isotopes, 11B (80.1%) and 10B (19.9%). In nuclear industry boron is commonly used as a neutron absorber due to the high neutron cross-section of isotope 10B.
Carbon
15 MPa
Carbon is a chemical element with atomic number 6 which means there are 6 protons and 6 electrons in the atomic structure. The chemical symbol for Carbon is C.
It is nonmetallic and tetravalent—making four electrons available to form covalent chemical bonds. Carbon is one of the few elements known since antiquity. Carbon is the 15th most abundant element in the Earth’s crust, and the fourth most abundant element in the universe by mass after hydrogen, helium, and oxygen.
Nitrogen
N/A
Nitrogen is a chemical element with atomic number 7 which means there are 7 protons and 7 electrons in the atomic structure. The chemical symbol for Nitrogen is N.
Nitrogen is a colourless, odourless unreactive gas that forms about 78% of the earth’s atmosphere. Liquid nitrogen (made by distilling liquid air) boils at 77.4 kelvins (−195.8°C) and is used as a coolant.
Oxygen
N/A
Oxygen is a chemical element with atomic number 8 which means there are 8 protons and 8 electrons in the atomic structure. The chemical symbol for Oxygen is O.
Oxygen is a colourless, odourless reactive gas, the chemical element of atomic number 8 and the life-supporting component of the air. It is a member of the chalcogen group on the periodic table, a highly reactive nonmetal, and an oxidizing agent that readily forms oxides with most elements as well as with other compounds. By mass, oxygen is the third-most abundant element in the universe, after hydrogen and helium.
Fluorine
N/A
Fluorine is a chemical element with atomic number 9 which means there are 9 protons and 9 electrons in the atomic structure. The chemical symbol for Fluorine is F.
Fluorine is the lightest halogen and exists as a highly toxic pale yellow diatomic gas at standard conditions. As the most electronegative element, it is extremely reactive: almost all other elements, including some noble gases, form compounds with fluorine.
Neon
N/A
Neon is a chemical element with atomic number 10 which means there are 10 protons and 10 electrons in the atomic structure. The chemical symbol for Neon is Ne.
Neon is a colorless, odorless, inert monatomic gas under standard conditions, with about two-thirds the density of air.
Sodium
N/A
Sodium is a chemical element with atomic number 11 which means there are 11 protons and 11 electrons in the atomic structure. The chemical symbol for Sodium is Na.
Sodium is a soft, silvery-white, highly reactive metal. Sodium is an alkali metal, being in group 1 of the periodic table, because it has a single electron in its outer shell that it readily donates, creating a positively charged atom—the Na+ cation.
Magnesium
200 MPa
Magnesium is a chemical element with atomic number 12 which means there are 12 protons and 12 electrons in the atomic structure. The chemical symbol for Magnesium is Mg.
Magnesium is a shiny gray solid which bears a close physical resemblance to the other five elements in the second column (group 2, or alkaline earth metals) of the periodic table: all group 2 elements have the same electron configuration in the outer electron shell and a similar crystal structure.
Aluminium
90 MPa (pure)
Aluminum is a chemical element with atomic number 13 which means there are 13 protons and 13 electrons in the atomic structure. The chemical symbol for Aluminum is Al.
Aluminium is a silvery-white, soft, nonmagnetic, ductile metal in the boron group. By mass, aluminium makes up about 8% of the Earth’s crust; it is the third most abundant element after oxygen and silicon and the most abundant metal in the crust, though it is less common in the mantle below.
Silicon
170 MPa
Silicon is a chemical element with atomic number 14 which means there are 14 protons and 14 electrons in the atomic structure. The chemical symbol for Silicon is Si.
Silicon is a hard and brittle crystalline solid with a blue-grey metallic lustre, it is a tetravalent metalloid and semiconductor.
Phosphorus
N/A
Phosphorus is a chemical element with atomic number 15 which means there are 15 protons and 15 electrons in the atomic structure. The chemical symbol for Phosphorus is P.
As an element, phosphorus exists in two major forms—white phosphorus and red phosphorus—but because it is highly reactive, phosphorus is never found as a free element on Earth. At 0.099%, phosphorus is the most abundant pnictogen in the Earth’s crust.
Sulfur
N/A
Sulfur is a chemical element with atomic number 16 which means there are 16 protons and 16 electrons in the atomic structure. The chemical symbol for Sulfur is S.
Sulfur is abundant, multivalent, and nonmetallic. Under normal conditions, sulfur atoms form cyclic octatomic molecules with a chemical formula S8. Elemental sulfur is a bright yellow crystalline solid at room temperature. Chemically, sulfur reacts with all elements except for gold, platinum, iridium, tellurium, and the noble gases.
Chlorine
N/A
Chlorine is a chemical element with atomic number 17 which means there are 17 protons and 17 electrons in the atomic structure. The chemical symbol for Chlorine is Cl.
Chlorine is a yellow-green gas at room temperature. It is an extremely reactive element and a strong oxidising agent: among the elements, it has the highest electron affinity and the third-highest electronegativity, behind only oxygen and fluorine.
Argon
N/A
Argon is a chemical element with atomic number 18 which means there are 18 protons and 18 electrons in the atomic structure. The chemical symbol for Argon is Ar.
Argon is the third-most abundant gas in the Earth’s atmosphere, at 0.934% (9340 ppmv). Argon is mostly used as an inert shielding gas in welding and other high-temperature industrial processes where ordinarily unreactive substances become reactive; for example, an argon atmosphere is used in graphite electric furnaces to prevent the graphite from burning.
Potassium
N/A
Potassium is a chemical element with atomic number 19 which means there are 19 protons and 19 electrons in the atomic structure. The chemical symbol for Potassium is K.
Potassium was first isolated from potash, the ashes of plants, from which its name derives. In the periodic table, potassium is one of the alkali metals. All of the alkali metals have a single valence electron in the outer electron shell, which is easily removed to create an ion with a positive charge – a cation, which combines with anions to form salts. Naturally occurring potassium is composed of three isotopes, of which 40K is radioactive.
Calcium
110 MPa
Calcium is a chemical element with atomic number 20 which means there are 20 protons and 20 electrons in the atomic structure. The chemical symbol for Calcium is Ca.
Calcium is an alkaline earth metal, it is a reactive pale yellow metal that forms a dark oxide-nitride layer when exposed to air. Its physical and chemical properties are most similar to its heavier homologues strontium and barium. It is the fifth most abundant element in Earth’s crust and the third most abundant metal, after iron and aluminium.
Scandium
200 MPa
Scandium is a chemical element with atomic number 21 which means there are 21 protons and 21 electrons in the atomic structure. The chemical symbol for Scandium is Sc.
Scandium is a silvery-white metallic d-block element, it has historically been sometimes classified as a rare-earth element, together with yttrium and the lanthanides.
Titanium
343 MPa, 293 MPa (pure)
Titanium is a chemical element with atomic number 22 which means there are 22 protons and 22 electrons in the atomic structure. The chemical symbol for Titanium is Ti. Titanium is a lustrous transition metal with a silver color, low density, and high strength. Titanium is resistant to corrosion in sea water, aqua regia, and chlorine. Titanium can be used in surface condensers. These condensers use tubes that are usually made of stainless steel, copper alloys, or titanium depending on several selection criteria (such as thermal conductivity or corrosion resistance). Titanium condenser tubes are usually the best technical choice, however titanium is very expensive material.
Vanadium
800 MPa
Vanadium is a chemical element with atomic number 23 which means there are 23 protons and 23 electrons in the atomic structure. The chemical symbol for Vanadium is V.
Vanadium is a hard, silvery grey, ductile, and malleable transition metal. The elemental metal is rarely found in nature, but once isolated artificially, the formation of an oxide layer (passivation) stabilizes the free metal somewhat against further oxidation.
Chromium
550 MPa
Chromium is a chemical element with atomic number 24 which means there are 24 protons and 24 electrons in the atomic structure. The chemical symbol for Chromium is Cr.
Chromium is a steely-grey, lustrous, hard and brittle metal4 which takes a high polish, resists tarnishing, and has a high melting point. A major development was the discovery that steel could be made highly resistant to corrosion and discoloration by adding metallic chromium to form stainless steel.
Manganese
650 MPa
Manganese is a chemical element with atomic number 25 which means there are 25 protons and 25 electrons in the atomic structure. The chemical symbol for Manganese is Mn.
Manganese is a metal with important industrial metal alloy uses, particularly in stainless steels.
Iron
540 MPa
Iron is a chemical element with atomic number 26 which means there are 26 protons and 26 electrons in the atomic structure. The chemical symbol for Iron is Fe.
Iron is a metal in the first transition series. It is by mass the most common element on Earth, forming much of Earth’s outer and inner core. It is the fourth most common element in the Earth’s crust. Its abundance in rocky planets like Earth is due to its abundant production by fusion in high-mass stars.
Cobalt
800 MPa
Cobalt is a chemical element with atomic number 27 which means there are 27 protons and 27 electrons in the atomic structure. The chemical symbol for Cobalt is Co.
Cobalt is found in the Earth’s crust only in chemically combined form, save for small deposits found in alloys of natural meteoric iron. The free element, produced by reductive smelting, is a hard, lustrous, silver-gray metal.
Nickel
345 MPa
Nickel is a chemical element with atomic number 28 which means there are 28 protons and 28 electrons in the atomic structure. The chemical symbol for Nickel is Ni.
Nickel is a silvery-white lustrous metal with a slight golden tinge. Nickel belongs to the transition metals and is hard and ductile.
Copper
210 MPa
Copper is a chemical element with atomic number 29 which means there are 29 protons and 29 electrons in the atomic structure. The chemical symbol for Copper is Cu.
Copper is a soft, malleable, and ductile metal with very high thermal and electrical conductivity. A freshly exposed surface of pure copper has a reddish-orange color. Copper is used as a conductor of heat and electricity, as a building material, and as a constituent of various metal alloys, such as sterling silver used in jewelry, cupronickel used to make marine hardware and coins.
Zinc
90 MPa
Zinc is a chemical element with atomic number 30 which means there are 30 protons and 30 electrons in the atomic structure. The chemical symbol for Zinc is Zn.
In some respects zinc is chemically similar to magnesium: both elements exhibit only one normal oxidation state (+2), and the Zn2+ and Mg2+ ions are of similar size.
Gallium
15 MPa
Gallium is a chemical element with atomic number 31 which means there are 31 protons and 31 electrons in the atomic structure. The chemical symbol for Gallium is Ga.
Gallium has similarities to the other metals of the group, aluminium, indium, and thallium. Gallium does not occur as a free element in nature, but as gallium(III) compounds in trace amounts in zinc ores and in bauxite.
Germanium
135 MPa
Germanium is a chemical element with atomic number 32 which means there are 32 protons and 32 electrons in the atomic structure. The chemical symbol for Germanium is Ge.
Germanium is a lustrous, hard, grayish-white metalloid in the carbon group, chemically similar to its group neighbors tin and silicon. Pure germanium is a semiconductor with an appearance similar to elemental silicon.
Arsenic
N/A
Arsenic is a chemical element with atomic number 33 which means there are 33 protons and 33 electrons in the atomic structure. The chemical symbol for Arsenic is As.
Arsenic occurs in many minerals, usually in combination with sulfur and metals, but also as a pure elemental crystal. Arsenic is a metalloid.
Selenium
300 MPa
Selenium is a chemical element with atomic number 34 which means there are 34 protons and 34 electrons in the atomic structure. The chemical symbol for Selenium is Se.
Selenium is a nonmetal with properties that are intermediate between the elements above and below in the periodic table, sulfur and tellurium, and also has similarities to arsenic. It rarely occurs in its elemental state or as pure ore compounds in the Earth’s crust.
Bromine
N/A
Bromine is a chemical element with atomic number 35 which means there are 35 protons and 35 electrons in the atomic structure. The chemical symbol for Bromine is Br.
Bromine is the third-lightest halogen, and is a fuming red-brown liquid at room temperature that evaporates readily to form a similarly coloured gas. Its properties are thus intermediate between those of chlorine and iodine.
Krypton
N/A
Krypton is a chemical element with atomic number 36 which means there are 36 protons and 36 electrons in the atomic structure. The chemical symbol for Krypton is Kr.
Krypton is a member of group 18 (noble gases) elements. A colorless, odorless, tasteless noble gas, krypton occurs in trace amounts in the atmosphere and is often used with other rare gases in fluorescent lamps.
Rubidium
N/A
Rubidium is a chemical element with atomic number 37 which means there are 37 protons and 37 electrons in the atomic structure. The chemical symbol for Rubidium is Rb.
Rubidium is a soft, silvery-white metallic element of the alkali metal group, with an atomic mass of 85.4678. Elemental rubidium is highly reactive, with properties similar to those of other alkali metals, including rapid oxidation in air.
Strontium
N/A
Strontium is a chemical element with atomic number 38 which means there are 38 protons and 38 electrons in the atomic structure. The chemical symbol for Strontium is Sr.
Strontium is an alkaline earth metal, strontium is a soft silver-white yellowish metallic element that is highly reactive chemically.
Yttrium
115 MPa
Yttrium is a chemical element with atomic number 39 which means there are 39 protons and 39 electrons in the atomic structure. The chemical symbol for Yttrium is Y.
Yttrium is a silvery-metallic transition metal chemically similar to the lanthanides and has often been classified as a “rare-earth element”.
Zirconium
330 MPa
Zirconium is a chemical element with atomic number 40 which means there are 40 protons and 40 electrons in the atomic structure. The chemical symbol for Zirconium is Zr. Zirconium is a lustrous, grey-white, strong transition metal that resembles hafnium and, to a lesser extent, titanium. Zirconium is mainly used as a refractory and opacifier, although small amounts are used as an alloying agent for its strong resistance to corrosion. Zirconium is widely used as a cladding for nuclear reactor fuels.
Niobium
275 MPa
Niobium is a chemical element with atomic number 41 which means there are 41 protons and 41 electrons in the atomic structure. The chemical symbol for Niobium is Nb.
Niobium is a soft, grey, ductile transition metal, often found in the minerals pyrochlore (the main commercial source for niobium) and columbite.
Molybdenum
324 MPa
Molybdenum is a chemical element with atomic number 42 which means there are 42 protons and 42 electrons in the atomic structure. The chemical symbol for Molybdenum is Mo.
Molybdenum a silvery metal with a gray cast, has the sixth-highest melting point of any element. It readily forms hard, stable carbides in alloys, and for this reason most of world production of the element (about 80%) is used in steel alloys, including high-strength alloys and superalloys.
Technetium
N/A
Technetium is a chemical element with atomic number 43 which means there are 43 protons and 43 electrons in the atomic structure. The chemical symbol for Technetium is Tc.
Technetium is the lightest element whose isotopes are all radioactive; none are stable. Nearly all technetium is produced synthetically, and only minute amounts are found in the Earth’s crust. The chemical properties of this silvery gray, crystalline transition metal are intermediate between rhenium and manganese.
Ruthenium
370 MPa
Ruthenium is a chemical element with atomic number 44 which means there are 44 protons and 44 electrons in the atomic structure. The chemical symbol for Ruthenium is Ru.
Ruthenium is a rare transition metal belonging to the platinum group of the periodic table. Like the other metals of the platinum group, ruthenium is inert to most other chemicals.
Rhodium
950 MPa
Rhodium is a chemical element with atomic number 45 which means there are 45 protons and 45 electrons in the atomic structure. The chemical symbol for Rhodium is Rh.
Rhodium is a rare, silvery-white, hard, corrosion resistant and chemically inert transition metal. It is a noble metal and a member of the platinum group.
Palladium
135 MPa
Palladium is a chemical element with atomic number 46 which means there are 46 protons and 46 electrons in the atomic structure. The chemical symbol for Palladium is Pd.
Palladium, platinum, rhodium, ruthenium, iridium and osmium form a group of elements referred to as the platinum group metals (PGMs). These have similar chemical properties, but palladium has the lowest melting point and is the least dense of them.
Silver
110 MPa
Silver is a chemical element with atomic number 47 which means there are 47 protons and 47 electrons in the atomic structure. The chemical symbol for Silver is Ag.
Silver is a soft, white, lustrous transition metal, it exhibits the highest electrical conductivity, thermal conductivity, and reflectivity of any metal. The metal is found in the Earth’s crust in the pure, free elemental form (“native silver”), as an alloy with gold and other metals, and in minerals such as argentite and chlorargyrite.
Cadmium
75 MPa
Cadmium is a chemical element with atomic number 48 which means there are 48 protons and 48 electrons in the atomic structure. The chemical symbol for Cadmium is Cd.
Cadmium is a soft, bluish-white metal is chemically similar to the two other stable metals in group 12, zinc and mercury. In nuclear industry cadmium is commonly used as a thermal neutron absorber due to very high neutron absorption cross-section of 113Cd. 113Cd has specific absorption cross-section.
Indium
2.5 MPa
Indium is a chemical element with atomic number 49 which means there are 49 protons and 49 electrons in the atomic structure. The chemical symbol for Indium is In.
Indium is a post-transition metal that makes up 0.21 parts per million of the Earth’s crust. Very soft and malleable, indium has a melting point higher than sodium and gallium, but lower than lithium and tin. Chemically, indium is similar to gallium and thallium.
Tin
220 MPa
Tin is a chemical element with atomic number 50 which means there are 50 protons and 50 electrons in the atomic structure. The chemical symbol for Tin is Sn.
Tin is a post-transition metal in group 14 of the periodic table. It is obtained chiefly from the mineral cassiterite, which contains tin dioxide. The first alloy used on a large scale was bronze, made of tin and copper, from as early as 3000 BC.
Antimony
11 MPa
Antimony is a chemical element with atomic number 51 which means there are 51 protons and 51 electrons in the atomic structure. The chemical symbol for Antimony is Sb.
Antimony is a lustrous gray metalloid, it is found in nature mainly as the sulfide mineral stibnite. Antimony compounds have been known since ancient times and were powdered for use as medicine and cosmetics, often known by the Arabic name, kohl.
Tellurium
11 MPa
Tellurium is a chemical element with atomic number 52 which means there are 52 protons and 52 electrons in the atomic structure. The chemical symbol for Tellurium is Te.
Tellurium is a brittle, mildly toxic, rare, silver-white metalloid. Tellurium is chemically related to selenium and sulfur. It is occasionally found in native form as elemental crystals. Tellurium is far more common in the universe as a whole than on Earth. Its extreme rarity in the Earth’s crust, comparable to that of platinum.
Iodine
N/A
Iodine is a chemical element with atomic number 53 which means there are 53 protons and 53 electrons in the atomic structure. The chemical symbol for Iodine is I.
Iodine is the heaviest of the stable halogens, it exists as a lustrous, purple-black metallic solid at standard conditions that sublimes readily to form a violet gas. Iodine is the least abundant of the stable halogens, being the sixty-first most abundant element. It is even less abundant than the so-called rare earths. It is the heaviest essential mineral nutrient.
Xenon
N/A
Xenon is a chemical element with atomic number 54 which means there are 54 protons and 54 electrons in the atomic structure. The chemical symbol for Xenon is Xe.
Xenon is a colorless, dense, odorless noble gas found in the Earth’s atmosphere in trace amounts. The name xenon for this gas comes from the Greek word ξένον [xenon], neuter singular form of ξένος [xenos], meaning ‘foreign(er)’, ‘strange(r)’, or ‘guest’. In nuclear industry, especially artificial xenon 135 has a tremendous impact on the operation of a nuclear reactor.
Caesium
N/A
Caesium is a chemical element with atomic number 55 which means there are 55 protons and 55 electrons in the atomic structure. The chemical symbol for Caesium is Cs.
Caesium is a soft, silvery-gold alkali metal with a melting point of 28.5 °C, which makes it one of only five elemental metals that are liquid at or near room temperature. Caesium has physical and chemical properties similar to those of rubidium and potassium.
Barium
N/A
Barium is a chemical element with atomic number 56 which means there are 56 protons and 56 electrons in the atomic structure. The chemical symbol for Barium is Ba.
Barium is the fifth element in group 2 and is a soft, silvery alkaline earth metal. Because of its high chemical reactivity, barium is never found in nature as a free element. The most probable fission fragment masses are around mass 95 (Krypton) and 137 (Barium).
Lanthanoids
Hafnium
480 MPa
Hafnium is a chemical element with atomic number 72 which means there are 72 protons and 72 electrons in the atomic structure. The chemical symbol for Hafnium is Hf. Hafnium is a lustrous, silvery gray, tetravalent transition metal, hafnium chemically resembles zirconium and is found in many zirconium minerals. Hafnium’s large neutron capture cross-section makes it a good material for neutron absorption in control rods in nuclear power plants, but at the same time requires that it be removed from the neutron-transparent corrosion-resistant zirconium alloys used in nuclear reactors.
Tantalum
760 MPa
Tantalum is a chemical element with atomic number 73 which means there are 73 protons and 73 electrons in the atomic structure. The chemical symbol for Tantalum is Ta.
Tantalum is a rare, hard, blue-gray, lustrous transition metal that is highly corrosion-resistant.
Tungsten
980 MPa
Tungsten is a chemical element with atomic number 74 which means there are 74 protons and 74 electrons in the atomic structure. The chemical symbol for Tungsten is W.
Tungsten is a rare metal found naturally on Earth almost exclusively in chemical compounds. Tungsten is an intrinsically brittle and hard material, making it difficult to work.
Rhenium
1070 MPa
Rhenium is a chemical element with atomic number 75 which means there are 75 protons and 75 electrons in the atomic structure. The chemical symbol for Rhenium is Re.
Rhenium is a silvery-white, heavy, third-row transition metal in group 7 of the periodic table.
Osmium
1000 MPa
Osmium is a chemical element with atomic number 76 which means there are 76 protons and 76 electrons in the atomic structure. The chemical symbol for Osmium is Os. Osmium is a hard, brittle, bluish-white transition metal in the platinum group that is found as a trace element in alloys, mostly in platinum ores. Osmium is the densest naturally occurring element, with a density of 22.59 g/cm3. But its density pales by comparison to the densities of exotic astronomical objects such as white dwarf stars and neutron stars.
Iridium
2000 MPa
Iridium is a chemical element with atomic number 77 which means there are 77 protons and 77 electrons in the atomic structure. The chemical symbol for Iridium is Ir.
Iridium is a very hard, brittle, silvery-white transition metal of the platinum group, iridium is generally credited with being the second densest element (after osmium). It is also the most corrosion-resistant metal, even at temperatures as high as 2000 °C.
Platinum
150 MPa
Platinum is a chemical element with atomic number 78 which means there are 78 protons and 78 electrons in the atomic structure. The chemical symbol for Platinum is Pt. Platinum is a dense, malleable, ductile, highly unreactive, precious, silverish-white transition metal. Platinum is one of the least reactive metals. It has remarkable resistance to corrosion, even at high temperatures, and is therefore considered a noble metal. Platinum is used in catalytic converters, laboratory equipment, electrical contacts and electrodes, platinum resistance thermometers, dentistry equipment, and jewelry.
Gold
220 MPa
Gold is a chemical element with atomic number 79 which means there are 79 protons and 79 electrons in the atomic structure. The chemical symbol for Gold is Au.
Gold is a bright, slightly reddish yellow, dense, soft, malleable, and ductile metal. Gold is a transition metal and a group 11 element. It is one of the least reactive chemical elements and is solid under standard conditions. Gold is thought to have been produced in supernova nucleosynthesis, from the collision of neutron stars.
Mercury
N/A
Mercury is a chemical element with atomic number 80 which means there are 80 protons and 80 electrons in the atomic structure. The chemical symbol for Mercury is Hg.
Mercury is commonly known as quicksilver and was formerly named hydrargyrum. Mercury is a heavy, silvery d-block element, mercury is the only metallic element that is liquid at standard conditions for temperature and pressure.
Thallium
8 MPa
Thallium is a chemical element with atomic number 81 which means there are 81 protons and 81 electrons in the atomic structure. The chemical symbol for Thallium is Tl.
Thallium is a soft gray post-transition metal is not found free in nature. Commercially, thallium is produced as a byproduct from refining of heavy metal sulfide ores. Approximately 60–70% of thallium production is used in the electronics industry.
Lead
17 MPa
Lead is a chemical element with atomic number 82 which means there are 82 protons and 82 electrons in the atomic structure. The chemical symbol for Lead is Pb.
Lead is a heavy metal that is denser than most common materials. Lead is soft and malleable, and has a relatively low melting point. Lead is widely used as a gamma shield. Major advantage of lead shield is in its compactness due to its higher density. Lead has the highest atomic number of any stable element and concludes three major decay chains of heavier elements.
Bismuth
4 MPa
Bismuth is a chemical element with atomic number 83 which means there are 83 protons and 83 electrons in the atomic structure. The chemical symbol for Bismuth is Bi.
Bismuth is a brittle metal with a silvery white color when freshly produced, but surface oxidation can give it a pink tinge. Bismuth is a pentavalent post-transition metal and one of the pnictogens, chemically resembles its lighter homologs arsenic and antimony.
Polonium
N/A
Polonium is a chemical element with atomic number 84 which means there are 84 protons and 84 electrons in the atomic structure. The chemical symbol for Polonium is Po.
Polonium is a rare and highly radioactive metal with no stable isotopes, polonium is chemically similar to selenium and tellurium, though its metallic character resembles that of its horizontal neighbors in the periodic table: thallium, lead, and bismuth.
Astatine
N/A
Astatine is a chemical element with atomic number 85 which means there are 85 protons and 85 electrons in the atomic structure. The chemical symbol for Astatine is At.
Astatine is the rarest naturally occurring element on the Earth’s crust. It occurs on Earth as the decay product of various heavier elements. The bulk properties of astatine are not known with any certainty.
Radon
N/A
Radon is a chemical element with atomic number 86 which means there are 86 protons and 86 electrons in the atomic structure. The chemical symbol for Radon is Rn.
Radon is a radioactive, colorless, odorless, tasteless noble gas. Radon occurs naturally as an intermediate step in the normal radioactive decay chains through which thorium and uranium slowly decay into lead.
Francium
N/A
Francium is a chemical element with atomic number 87 which means there are 87 protons and 87 electrons in the atomic structure. The chemical symbol for Francium is Fr.
Francium is an alkali metal, that has one valence electron. Francium is the second-least electronegative element, behind only caesium, and is the second rarest naturally occurring element (after astatine). Francium is a highly radioactive metal that decays into astatine, radium, and radon.
Radium
N/A
Radium is a chemical element with atomic number 88 which means there are 88 protons and 88 electrons in the atomic structure. The chemical symbol for Radium is Ra.
Pure radium is silvery-white alkaline earth metal. All isotopes of radium are highly radioactive, with the most stable isotope being radium-226.
Actinoids
Rutherfordium
N/A
Dubnium
N/A
Seaborgium
N/A
Bohrium
N/A
Hassium
N/A
Meitnerium
N/A
Darmstadtium
N/A
Roentgenium
N/A
Copernicium
N/A
Nihonium
N/A
Flerovium
N/A
Moscovium
N/A
Livermorium
N/A
Tennessine
N/A
Oganesson
N/A
Lanthanum
130 MPa
Lanthanum is a chemical element with atomic number 57 which means there are 57 protons and 57 electrons in the atomic structure. The chemical symbol for Lanthanum is La.
Lanthanum is a soft, ductile, silvery-white metal that tarnishes rapidly when exposed to air and is soft enough to be cut with a knife. It is the eponym of the lanthanide series, a group of 15 similar elements between lanthanum and lutetium in the periodic table, of which lanthanum is the first and the prototype. It is also sometimes considered the first element of the 6th-period transition metals and is traditionally counted among the rare earth elements.
Cerium
100 MPa
Cerium is a chemical element with atomic number 58 which means there are 58 protons and 58 electrons in the atomic structure. The chemical symbol for Cerium is Ce.
Cerium is a soft, ductile and silvery-white metal that tarnishes when exposed to air, and it is soft enough to be cut with a knife. Cerium is the second element in the lanthanide series. Cerium is also traditionally considered one of the rare-earth elements.
Praseodymium
110 MPa
Praseodymium is a chemical element with atomic number 59 which means there are 59 protons and 59 electrons in the atomic structure. The chemical symbol for Praseodymium is Pr.
Praseodymium is a soft, silvery, malleable and ductile metal, valued for its magnetic, electrical, chemical, and optical properties. Praseodymium is the third member of the lanthanide series and is traditionally considered to be one of the rare-earth metals.
Neodymium
155 MPa
Neodymium is a chemical element with atomic number 60 which means there are 60 protons and 60 electrons in the atomic structure. The chemical symbol for Neodymium is Nd.
Neodymium is a soft silvery metal that tarnishes in air. Neodymium is not found naturally in metallic form or unmixed with other lanthanides, and it is usually refined for general use. Although neodymium is classed as a rare earth, it is a fairly common element.
Promethium
160 MPa
Promethium is a chemical element with atomic number 61 which means there are 61 protons and 61 electrons in the atomic structure. The chemical symbol for Promethium is Pm.
Promethium is one of only two such elements that are followed in the periodic table by elements with stable forms. All of its isotopes are radioactive. In nuclear reactors, promethium equilibrium exists in power operation. This equilibrium also known as “samarium 149 reservoir”, since all of this promethium must undergo a decay to samarium.
Samarium
124 MPa
Samarium is a chemical element with atomic number 62 which means there are 62 protons and 62 electrons in the atomic structure. The chemical symbol for Samarium is Sm. Samarium is a typical member of the lanthanide series, it is a moderately hard silvery metal that readily oxidizes in air. The name samarium is after the mineral samarskite from which it was isolated. Although classified as a rare earth element, samarium is the 40th most abundant element in the Earth’s crust and is more common than such metals as tin. In nuclear industry, especially natural and artificial samarium 149 has an important impact on the operation of a nuclear reactor.
Europium
120 MPa
Europium is a chemical element with atomic number 63 which means there are 63 protons and 63 electrons in the atomic structure. The chemical symbol for Europium is Eu.
Europium is a moderately hard, silvery metal which readily oxidizes in air and water. Being a typical member of the lanthanide series, europium usually assumes the oxidation state +3. Europium is one of the least abundant elements in the universe. Only about 5×10⁻⁸% of all matter in the universe is europium.
Gadolinium
170 MPa
Gadolinium is a chemical element with atomic number 64 which means there are 64 protons and 64 electrons in the atomic structure. The chemical symbol for Gadolinium is Gd.
Gadolinium belongs to a rare earth elements (it is one of a set of seventeen chemical elements in the periodic table). In nuclear industry gadolinium is commonly used as a neutron absorber due to very high neutron absorbtion cross-section of two isotopes 155Gd and 157Gd. In fact their absorption cross-sections are the highest among all stable isotopes.
Terbium
N/A
Terbium is a chemical element with atomic number 65 which means there are 65 protons and 65 electrons in the atomic structure. The chemical symbol for Terbium is Tb.
Terbium is a silvery-white, rare earth metal that is malleable, ductile, and soft enough to be cut with a knife. The ninth member of the lanthanide series, terbium is a fairly electropositive metal that reacts with water, evolving hydrogen gas.
Dysprosium
220 MPa
Dysprosium is a chemical element with atomic number 66 which means there are 66 protons and 66 electrons in the atomic structure. The chemical symbol for Dysprosium is Dy.
is a rare earth element with a metallic silver luster. Dysprosium is used for its high thermal neutron absorption cross-section in making control rods in nuclear reactors, for its high magnetic susceptibility in data storage applications.
Holmium
260 MPa
Holmium is a chemical element with atomic number 67 which means there are 67 protons and 67 electrons in the atomic structure. The chemical symbol for Holmium is Ho.
Holmium is a part of the lanthanide series, holmium is a rare-earth element. Holmium is a relatively soft and malleable silvery-white metal.
Erbium
260 MPa
Erbium is a chemical element with atomic number 68 which means there are 68 protons and 68 electrons in the atomic structure. The chemical symbol for Erbium is Er.
Erbium is a silvery-white solid metal when artificially isolated, natural erbium is always found in chemical combination with other elements. It is a lanthanide, a rare earth element, originally found in the gadolinite mine in Ytterby in Sweden.
Thulium
N/A
Thulium is a chemical element with atomic number 69 which means there are 69 protons and 69 electrons in the atomic structure. The chemical symbol for Thulium is Tm.
Thulium is an easily workable metal with a bright silvery-gray luster. It is fairly soft and slowly tarnishes in air. Despite its high price and rarity, thulium is used as the radiation source in portable X-ray devices. Thulium is the thirteenth and third-last element in the lanthanide series.
Ytterbium
69 MPa
Ytterbium is a chemical element with atomic number 70 which means there are 70 protons and 70 electrons in the atomic structure. The chemical symbol for Ytterbium is Yb.
Because of its closed-shell electron configuration, its density and melting and boiling points differ significantly from those of most other lanthanides.
Lutetium
N/A
Lutetium is a chemical element with atomic number 71 which means there are 71 protons and 71 electrons in the atomic structure. The chemical symbol for Lutetium is Lu.
Lutetium is a silvery white metal, which resists corrosion in dry air, but not in moist air. Lutetium is the last element in the lanthanide series, and it is traditionally counted among the rare earths.
Actinium
N/A
Actinium is a chemical element with atomic number 89 which means there are 89 protons and 89 electrons in the atomic structure. The chemical symbol for Actinium is Ac.
Actinium is a soft, silvery-white radioactive metal. Actinium gave the name to the actinide series, a group of 15 similar elements between actinium and lawrencium in the periodic table.
Thorium
220 MPa
Thorium is a chemical element with atomic number 90 which means there are 90 protons and 90 electrons in the atomic structure. The chemical symbol for Thorium is Th.
Thorium metal is silvery and tarnishes black when exposed to air, forming the dioxide. Thorium is moderately hard, malleable, and has a high melting point. Thorium is a naturally-occurring element and it is estimated to be about three times more abundant than uranium. Thorium is commonly found in monazite sands (rare earth metals containing phosphate mineral).
Protactinium
N/A
Protactinium is a chemical element with atomic number 91 which means there are 91 protons and 91 electrons in the atomic structure. The chemical symbol for Protactinium is Pa.
Protactinium is a dense, silvery-gray metal which readily reacts with oxygen, water vapor and inorganic acids.
Uranium
390 MPa
Uranium is a chemical element with atomic number 92 which means there are 92 protons and 92 electrons in the atomic structure. The chemical symbol for Uranium is U.
Uranium is a silvery-white metal in the actinide series of the periodic table. Uranium is weakly radioactive because all isotopes of uranium are unstable, with half-lives varying between 159,200 years and 4.5 billion years. Uranium has the highest atomic weight of the primordially occurring elements. Its density is about 70% higher than that of lead, and slightly lower than that of gold or tungsten.
Neptunium
N/A
Neptunium is a chemical element with atomic number 93 which means there are 93 protons and 93 electrons in the atomic structure. The chemical symbol for Neptunium is Np.
Neptunium metal is silvery and tarnishes when exposed to air. Neptunium is the first transuranic element.
Plutonium
N/A
Plutonium is a chemical element with atomic number 94 which means there are 94 protons and 94 electrons in the atomic structure. The chemical symbol for Plutonium is Pu.
Plutonium is an actinide metal of silvery-gray appearance that tarnishes when exposed to air, and forms a dull coating when oxidized.
Americium
N/A
Americium is a chemical element with atomic number 95 which means there are 95 protons and 95 electrons in the atomic structure. The chemical symbol for Americium is Am.
Americium is a transuranic member of the actinide series, in the periodic table located under the lanthanide element europium, and thus by analogy was named after the Americas.
Curium
N/A
Curium is a chemical element with atomic number 96 which means there are 96 protons and 96 electrons in the atomic structure. The chemical symbol for Curium is Cm.
Curium is a hard, dense, silvery metal with a relatively high melting point and boiling point for an actinide.
Berkelium
N/A
Berkelium is a chemical element with atomic number 97 which means there are 97 protons and 97 electrons in the atomic structure. The chemical symbol for Berkelium is Bk.
Berkelium is a member of the actinide and transuranium element series.
Californium
N/A
Californium is a chemical element with atomic number 98 which means there are 98 protons and 98 electrons in the atomic structure. The chemical symbol for Californium is Cf.
Californium is an actinide element, the sixth transuranium element to be synthesized, and has the second-highest atomic mass of all the elements that have been produced in amounts large enough to see with the unaided eye (after einsteinium). The most commonly used spontaneous fission neutron source is the radioactive isotope californium-252.
Einsteinium
N/A
Einsteinium is a chemical element with atomic number 99 which means there are 99 protons and 99 electrons in the atomic structure. The chemical symbol for Einsteinium is Es.
Einsteinium is the seventh transuranic element, and an actinide.
Fermium
N/A
Fermium is a chemical element with atomic number 100 which means there are 100 protons and 100 electrons in the atomic structure. The chemical symbol for Fermium is Fm.
Fermium is a member of the actinide series. It is the heaviest element that can be formed by neutron bombardment of lighter elements, and hence the last element that can be prepared in macroscopic quantities.
Mendelevium
N/A
Mendelevium is a chemical element with atomic number 101 which means there are 101 protons and 101 electrons in the atomic structure. The chemical symbol for Mendelevium is Md.
Mendelevium is a metallic radioactive transuranic element in the actinide series, it is the first element that currently cannot be produced in macroscopic quantities.
Nobelium
N/A
Nobelium is a chemical element with atomic number 102 which means there are 102 protons and 102 electrons in the atomic structure. The chemical symbol for Nobelium is No.
Nobelium is the tenth transuranic element and is the penultimate member of the actinide series. Like all elements with atomic number over 100, nobelium can only be produced in particle accelerators by bombarding lighter elements with charged particles.
Lawrencium
N/A
Lawrencium is a chemical element with atomic number 103 which means there are 103 protons and 103 electrons in the atomic structure. The chemical symbol for Lawrencium is Lr.
Lawrencium is the final member of the actinide series. Like all elements with atomic number over 100, lawrencium can only be produced in particle accelerators by bombarding lighter elements with charged particles.
© 2019 material-properties.org / see also
www.nuclear-power.com
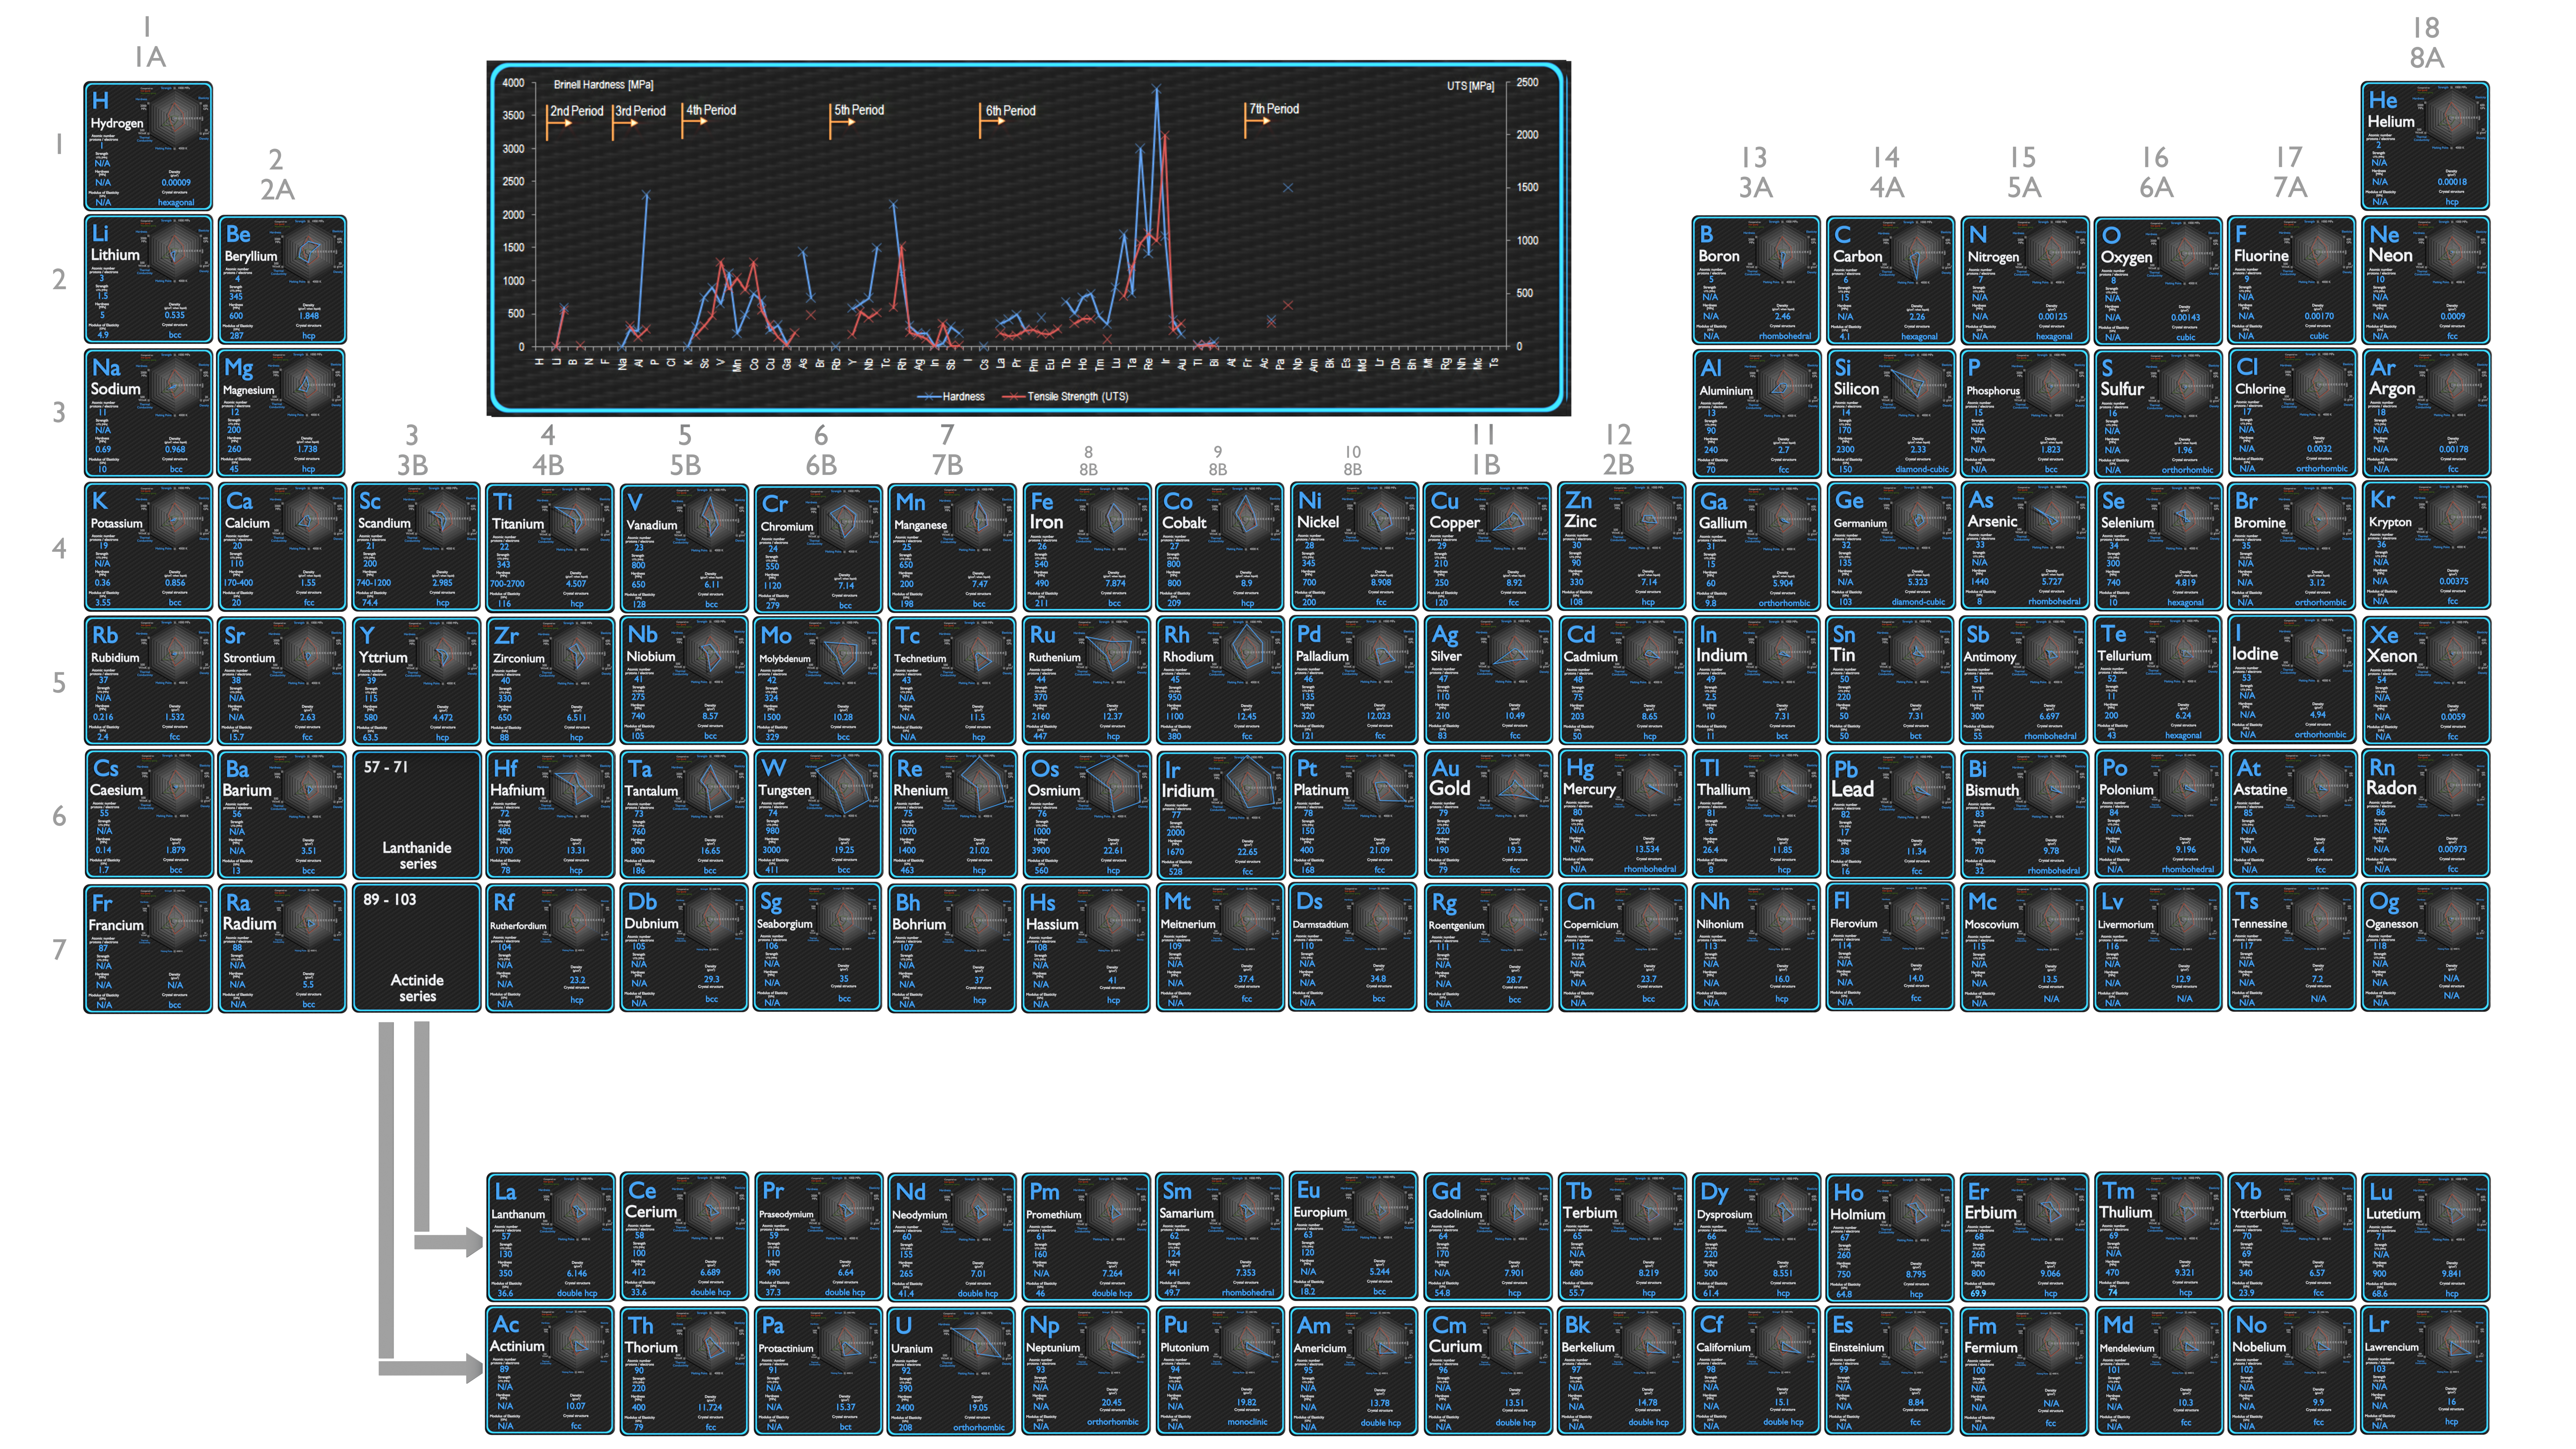
Strength of Chemical Materials
 Strength of materials basically considers the relationship between the external loads applied to a material and the resulting deformation or change in material dimensions. In designing structures and machines, it is important to consider these factors, in order that the material selected will have adequate strength to resist applied loads or forces and retain its original shape. Strength of a material is its ability to withstand this applied load without failure or plastic deformation.
However, we must note that the load which will deform a small component, will be less than the load to deform a larger component of the same material. Therefore, the load (force) is not a suitable term to describe strength. Instead, we can use the force (load) per unit of area (σ = F/A), called stress, which is constant (until deformation occurs) for a given material regardless of size of the component part. In this concept, strain is also very important variable, since it defines the deformation of an object. In summary, the mechanical behavior of solids is usually defined by constitutive stress-strain relations. A deformation is called elastic deformation, if the stress is a linear function of strain. In other words, stress and strain follows Hooke’s law. Beyond the linear region, stress and strain show nonlinear behavior. This inelastic behavior is called plastic deformation.
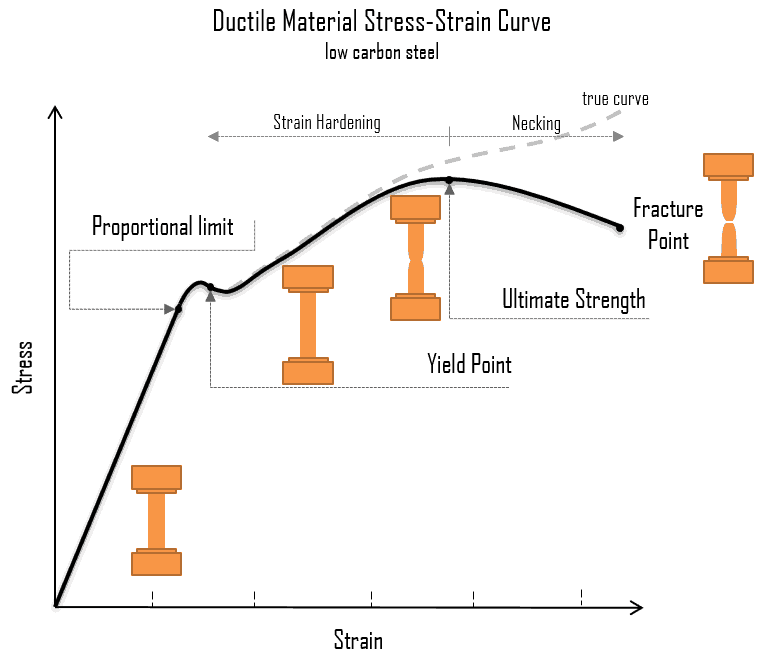
A schematic diagram for the stress-strain curve of low carbon steel at room temperature is shown in the figure. There are several stages showing different behaviors, which suggests different mechanical properties. To clarify, materials can miss one or more stages shown in the figure, or have totally different stages. In this case we have to distinguish between stress-strain characteristics of ductile and brittle materials. The following points describe the different regions of the stress-strain curve and the importance of several specific locations.
- Proportional limit. The proportional limit corresponds to the location of stress at the end of the linear region, so the stress-strain graph is a straight line, and the gradient will be equal to the elastic modulus of the material. For tensile and compressive stress, the slope of the portion of the curve where stress is proportional to strain is referred to as Young’s modulus and Hooke’s Law applies. Between the proportional limit and the yield point the Hooke’s Law becomes questionable between and strain increases more rapidly.
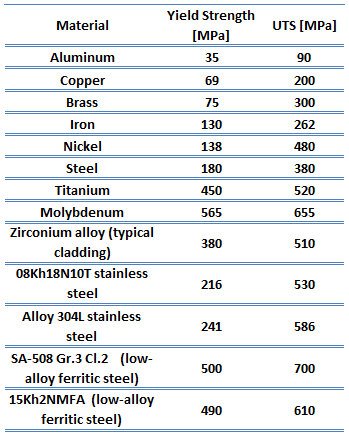 Yield point. The yield point is the point on a stress-strain curve that indicates the limit of elastic behavior and the beginning plastic behavior. Yield strength or yield stress is the material property defined as the stress at which a material begins to deform plastically whereas yield point is the point where nonlinear (elastic + plastic) deformation begins. Prior to the yield point, the material will deform elastically and will return to its original shape when the applied stress is removed. Once the yield point is passed, some fraction of the deformation will be permanent and non-reversible. Some steels and other materials exhibit a behaviour termed a yield point phenomenon. Yield strengths vary from 35 MPa for a low-strength aluminum to greater than 1400 MPa for very high-strength steels.
- Ultimate tensile strength. The ultimate tensile strength is the maximum on the engineering stress-strain curve. This corresponds to the maximum stress that can be sustained by a structure in tension. Ultimate tensile strength is often shortened to “tensile strength” or even to “the ultimate.” If this stress is applied and maintained, fracture will result. Often, this value is significantly more than the yield stress (as much as 50 to 60 percent more than the yield for some types of metals). When a ductile material reaches its ultimate strength, it experiences necking where the cross-sectional area reduces locally. The stress-strain curve contains no higher stress than the ultimate strength. Even though deformations can continue to increase, the stress usually decreases after the ultimate strength has been achieved. It is an intensive property; therefore its value does not depend on the size of the test specimen. However, it is dependent on other factors, such as the preparation of the specimen, the presence or otherwise of surface defects, and the temperature of the test environment and material. Ultimate tensile strengths vary from 50 MPa for an aluminum to as high as 3000 MPa for very high-strength steels.
- Fracture point: The fracture point is the point of strain where the material physically separates. At this point, the strain reaches its maximum value and the material actually fractures, even though the corresponding stress may be less than the ultimate strength at this point. Ductile materials have a fracture strength lower than the ultimate tensile strength (UTS), whereas in brittle materials the fracture strength is equivalent to the UTS. If a ductile material reaches its ultimate tensile strength in a load-controlled situation, it will continue to deform, with no additional load application, until it ruptures. However, if the loading is displacement-controlled, the deformation of the material may relieve the load, preventing rupture.
In many situations, the yield strength is used to identify the allowable stress to which a material can be subjected. For components that have to withstand high pressures, such as those used in pressurized water reactors (PWRs), this criterion is not adequate. To cover these situations, the maximum shear stress theory of failure has been incorporated into the ASME (The American Society of Mechanical Engineers) Boiler and Pressure Vessel Code, Section III, Rules for Construction of Nuclear Pressure Vessels. This theory states that failure of a piping component occurs when the maximum shear stress exceeds the shear stress at the yield point in a tensile test.